
The hydrogen trade map of 2030 will be wrong by 2040
- Ricardo Reina

- 6 days ago
- 6 min read
Every few months a new map of future hydrogen trade routes makes the rounds: arrows from Australia to Japan, from the Middle East to Korea, from Chile across the Pacific. These maps share a quiet assumption: that the corridors which open first will be the corridors that endure.
Our global hydrogen trade model suggests the opposite. We re-optimize supply, demand and flows for every five year period from 2025 to 2050, across 35 regions and four carriers, following the structure of IRENA's Global Hydrogen Trade Outlook. When we let the model redraw the map each period, the Asia Pacific corridors of 2030 look very little like those of 2040, and 2040 in turn differs from 2050. Three findings stand out.
Finding 1: the 2030 map is a Latin American story
In our central scenario, roughly a third of hydrogen demand is met through trade in every period. But the origins shift dramatically. In 2030, Japan's largest supplier is not Australia. It is Chile, shipping around 2.5 Mt of hydrogen as ammonia across the Pacific, with Colombia contributing another 1.6 Mt. China, far from exporting, is the region's largest importer, taking over 3 Mt from Australia plus cargoes from Colombia, South Africa and the rest of Latin America.
This is not an anomaly. In the early years, demand ramps faster than the lowest cost supply basins can build out. Buyers take hydrogen from whoever can deliver, and Latin America's early renewable cost advantage wins trans-Pacific routes almost by default. These early corridors are scarcity driven, not advantage driven.
Finding 2: within one investment cycle, China flips from importer to exporter
By 2035 the map inverts. China stops importing entirely and becomes Northeast Asia's largest exporter, sending liquefied hydrogen to Japan and Korea over short shipping distances. By 2040 those flows reach 5.8 Mt to Japan and 3.7 Mt to Korea. Australia scales in parallel, reaching 7.2 Mt to Japan.
Meanwhile the trans-Pacific corridors of 2030 vanish. Chilean ammonia to Japan, the single largest corridor of the early 2030s, disappears from the optimal solution by mid decade, displaced by closer and cheaper supply.
Consider what that means for an asset financed today. A receiving terminal in China sized on 2030 import flows would be structurally redundant by 2035. A Chilean export terminal built around Japanese offtake would watch its anchor market disappear five years after commissioning. Both assets would be less than a third of the way through a typical 25 year concession.
Finding 3: the 2050 map reshuffles again
The story does not settle in 2040. By 2050, Australia is dominant across the region, supplying Japan, Korea, India, Indonesia, Singapore and Southeast Asia with close to 30 Mt in total. China's export role recedes as its own demand absorbs domestic production. And Chile returns: the corridor to Japan that vanished in the 2030s reappears at 6.5 Mt, larger than it ever was, once Japanese demand outgrows what nearby suppliers can deliver. Even Atlantic producers such as Spain and Canada begin reaching Asian markets.
A corridor that opens, closes and reopens is a nightmare for project finance, which prices assets on continuous utilization. Yet this pattern falls naturally out of cost optimization: corridors are not permanent franchises but temporary answers to a question the market re-asks every few years, namely who can deliver the next tonne cheapest.
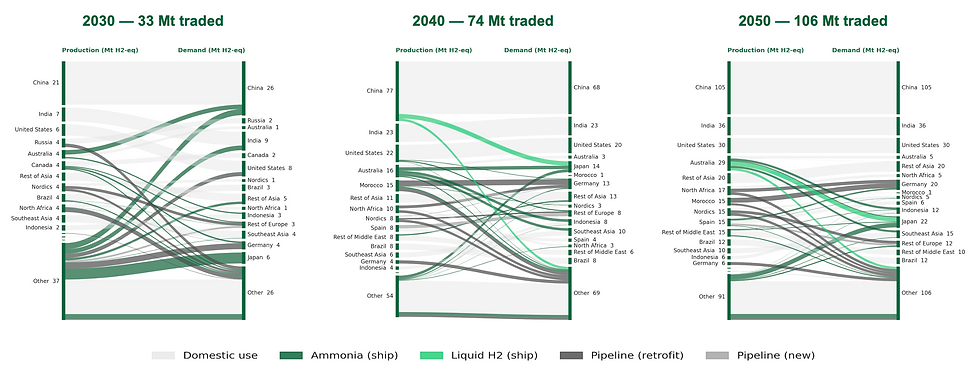
Global trade flows in each decade
LNG already ran this experiment
Hydrogen will not be the first molecule to live through this tension. LNG began exactly the same way. The industry's first four decades were built on 20 year take or pay contracts, oil indexed, with destination clauses that fixed a cargo's route from a named liquefaction train to a named regasification terminal. Those contracts were not a market failure. They were the only way to finance capital that lumpy, and early hydrogen infrastructure will be financed on the same logic, correctly.
But the contracting model that builds an industry is not the model the mature industry runs on. Spot and short term cargoes were around 5 percent of LNG trade in 2000. Today they are roughly a third, and destination flexibility is standard for new US volumes. As liquidity deepened, the rigidity that made the first projects bankable became a liability, and the market sorted participants into winners and losers along exactly the fault line our hydrogen model exposes.
The winners were the flexible. Qatar built scale with a shipping fleet able to divert cargoes, so when US shale erased the American import demand its trains were partly built for, it simply redirected volumes to Asia and Europe. US exporters like Cheniere sold destination free FOB volumes and let buyers carry the routing risk. And the portfolio players, Shell, TotalEnergies and the trading houses, became the market's most profitable participants by sitting between rigid long term supply and flexible short term demand, capturing the spread.
The losers were the locked in. Japanese and Indian buyers spent the 2010s renegotiating oil indexed contracts signed above prevailing spot prices. Egypt's liquefaction plants sat idle when domestic demand absorbed their feedgas. And the clearest case of all: the wave of US regasification terminals built in the 2000s for an import boom that shale cancelled. Billions in receiving infrastructure was stranded within a decade of commissioning. Tellingly, the assets that recovered were the ones that could be repurposed. Sabine Pass, Cameron, Cove Point and Elba were reborn as export terminals, which is residual value planning by accident rather than design.
The hydrogen twist is that the transition to spot could run faster than LNG's four decades. Ammonia, the dominant carrier in nearly all our runs, is already a globally traded commodity with existing terminals, ships and benchmarks. The scaffolding for a liquid market exists before the trade does. Infrastructure financed in the late 2020s on 20 year bilateral contracts may find itself competing in a substantially spot traded market well before those contracts expire.
What this means for infrastructure being built now
Four practical implications for developers, offtakers and lenders in the region:
Build for the carrier, not the corridor. Across nearly every scenario and period we run, ammonia dominates long haul trade. An ammonia import terminal keeps its value even when the origin of the cargo changes, because the vessel and the molecules look the same whether they load in Chile, Australia or the Gulf. Origin flexibility is cheap insurance; carrier flexibility is expensive and mostly unnecessary.
Treat liquefied hydrogen as a basin bet, not a global one. In our runs, LH2 is only competitive on short routes within Northeast Asia, principally China to Japan and Korea. Under pessimistic technology assumptions it disappears from the trade mix entirely. LH2 receiving infrastructure is therefore a concentrated bet on one basin and on liquefaction costs falling on schedule.
Accept long term contracts to build, but structure for the spot market that follows. The first wave of terminals will need 20 year offtake to reach financial close, exactly as LNG did. The mistake is not signing them; it is signing them as if the contracting environment of year one will still exist in year fifteen. Origin substitution clauses, destination flexibility, tenor laddering and review triggers cost little at signing and decide who ends up on which side of the LNG style winners and losers split.
Expect the first movers to be displaced, and plan for it. The corridors that open first do so because the cheapest suppliers are not ready, not because the early routes are structurally advantaged. Early infrastructure should be underwritten on residual value in a redrawn map: can the terminal serve domestic distribution, bunkering or a different trade lane when its founding corridor closes?
The caveat, and the point
A cost optimization model is not a forecast. Real corridors will be shaped by energy security policy, bilateral agreements and financing frictions that keep flows in place after pure economics has moved on. Japan and Korea will pay premiums for diversification. Some 2030 corridors will survive on politics alone.
But that is precisely the point. If a corridor only survives because policy holds it in place, its economics are already gone, and everyone underwriting it should know. The value of re-optimizing the map every five years is not predicting exactly which arrows appear. It is seeing which arrows are robust across scenarios, which are fragile, and which are living on borrowed time before the first cargo is even ordered.
This analysis draws on Catalyze Transition's global hydrogen trade flow model, which optimizes supply, demand and flows across 35 regions, four carriers and six five-year periods. Figures are from the central scenario and are illustrative. If you would like to explore the scenarios interactively or discuss what they mean for a specific asset or market, get in touch.


